5. Debugging
Cerebro application has built-in functionality to simplify testing and debugging for your Python modules. It is called from Python Debugging Panel. The panel is disabled by default. It can be enabled by the Main menu/View/ Python Debugging Panel checkbox.
Python Debugging Panel:
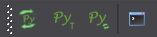
Panel buttons:

– restarts Python and all its modules without application restart. After the restart all the changes in modules are applied, menu items are regenerated (menu.init_menu() function is called) and logon is being handled (logon.logon() function is called).
Note
You don’t need to close the application to debug logoff handler (logoff.logoff() function), just log off without closing the software - Main menu/Cerebro Serpens/Log off.

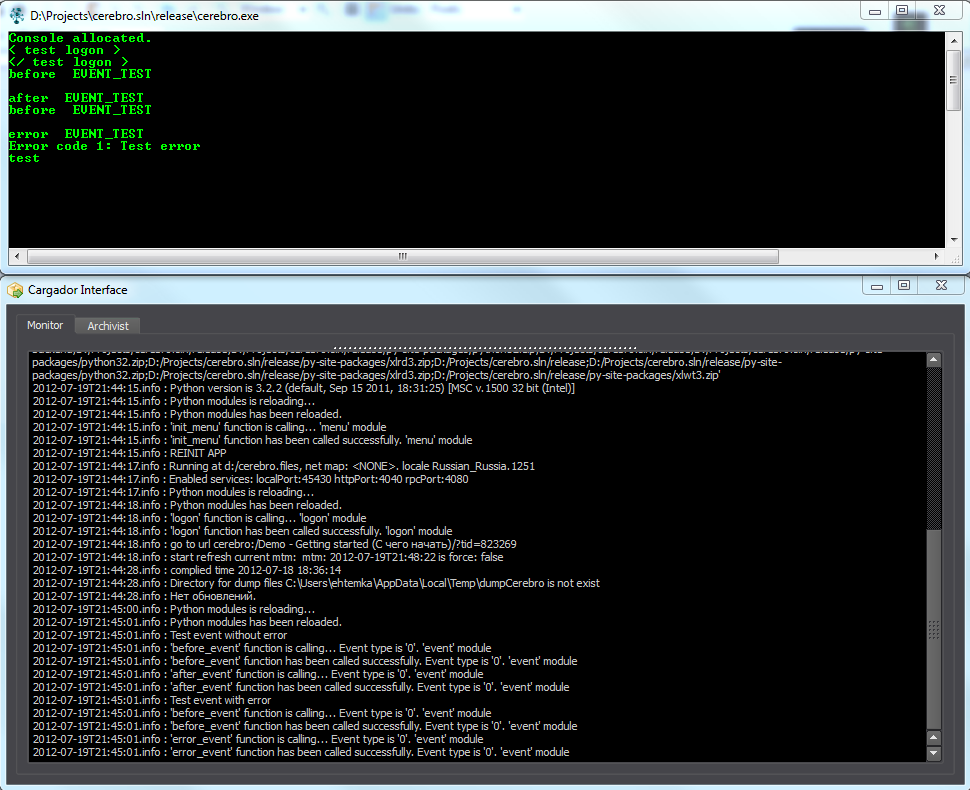
– generates a test event twice (cerebro.events.Event.EVENT_TEST) to check event system.
First call - no errors
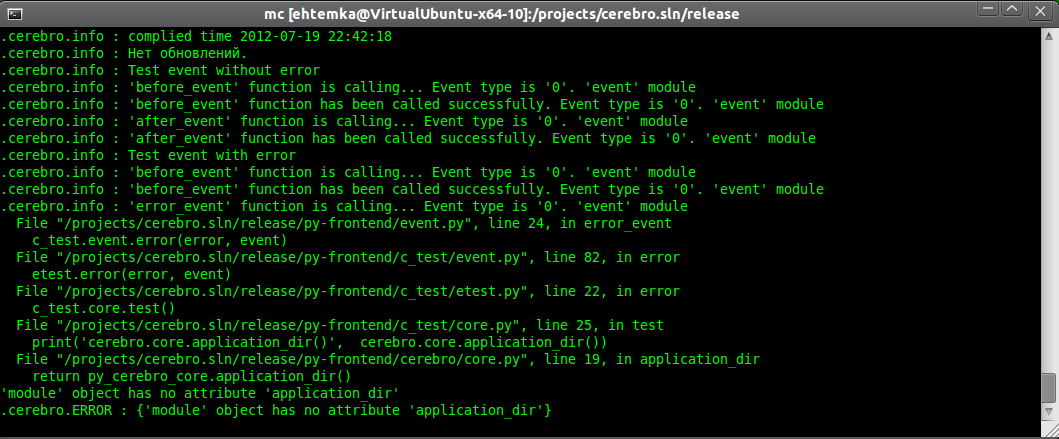
Second call - error
Python is restarted before generating an event. You can write some code for API learning and testing in the handler of this event. It will be executed every time you press this button.

– switches debugging mode. When on, every call to Python modules from the application makes the modules restart, thus applying all the changes in the real-time mode. It slows down the application performance, so don’t forget to turn this option off when you are done with debugging.

– opens Python modules output console. Available for Windows-based versions only.
5.1. Debugging information view
Under Linux and Mac OS X you need to launch Cerebro from a console (terminal) to view the debugging information. In this case the console (terminal) will display application debugging information and messages from Python modules.
Under Windows OS you need to open Python output console to view the messages from Python modules and open the Cargador interface to view application debugging information (Main menu/Tools/Cargador Interface).